ArgoCD and Grafana have been key building blocks in a big chunk of the Kubernetes environments I've worked with. ArgoCD provides continuous app delivery, while Grafana acts as the "single pane of glass" for ops/dev/product team observability.
Argo CD follows the GitOps pattern of using Git repositories as the source of truth for defining the desired application state.
Most teams have some metrics-based ArgoCD dashboards in Grafana.
This post aims to inspire you to maximize the value of these tools by exposing ArgoCD API data in Grafana.
Give non-technical users an answer to the perennial question of "what's running where" with Grafana and ArgoCD.
How to Connect Grafana with the ArgoCD API
ArgoCD has built-in support for Prometheus compatible metrics. The vendor-provided dashboards are beautiful, covering visibility over your Applications/ApplicationSets and other ArgoCD objects.
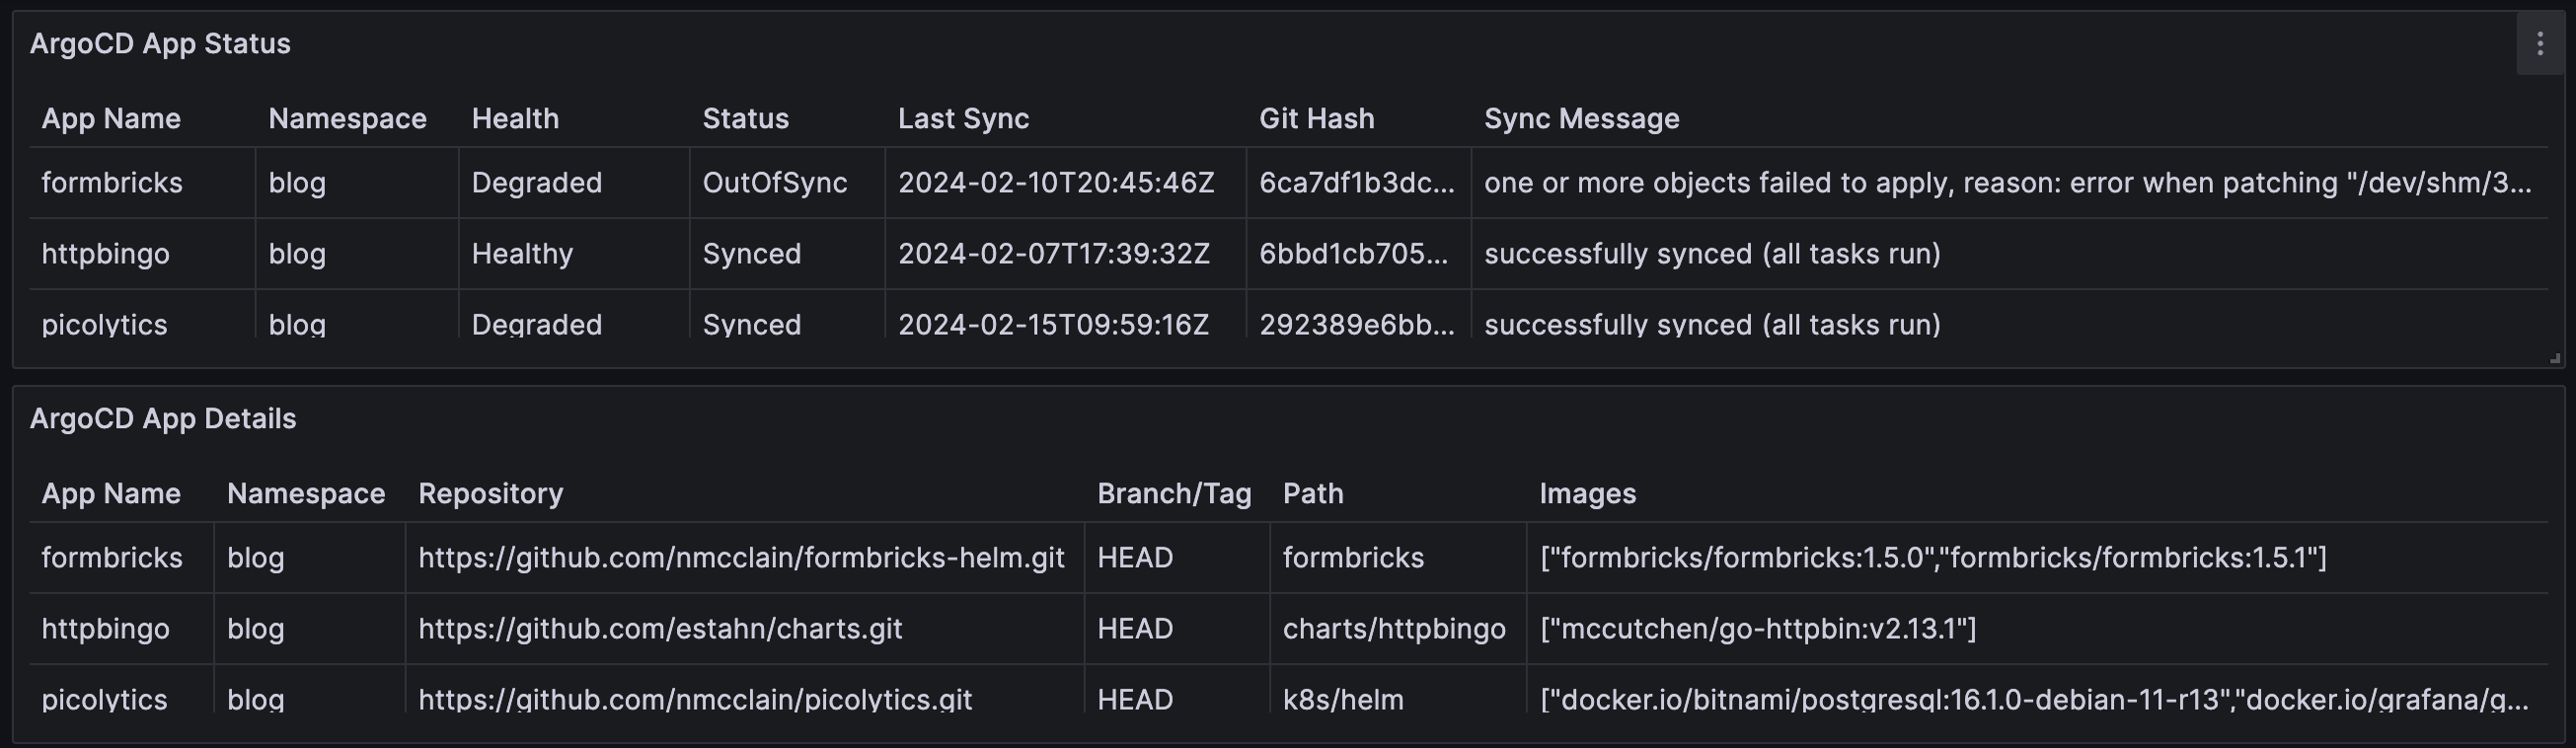
Unfortunately, the metric labels are not quite sufficient to fully answer the question "what version of each service is running where?" For that, we need to display the actual git hashes and image versions running on each pod.
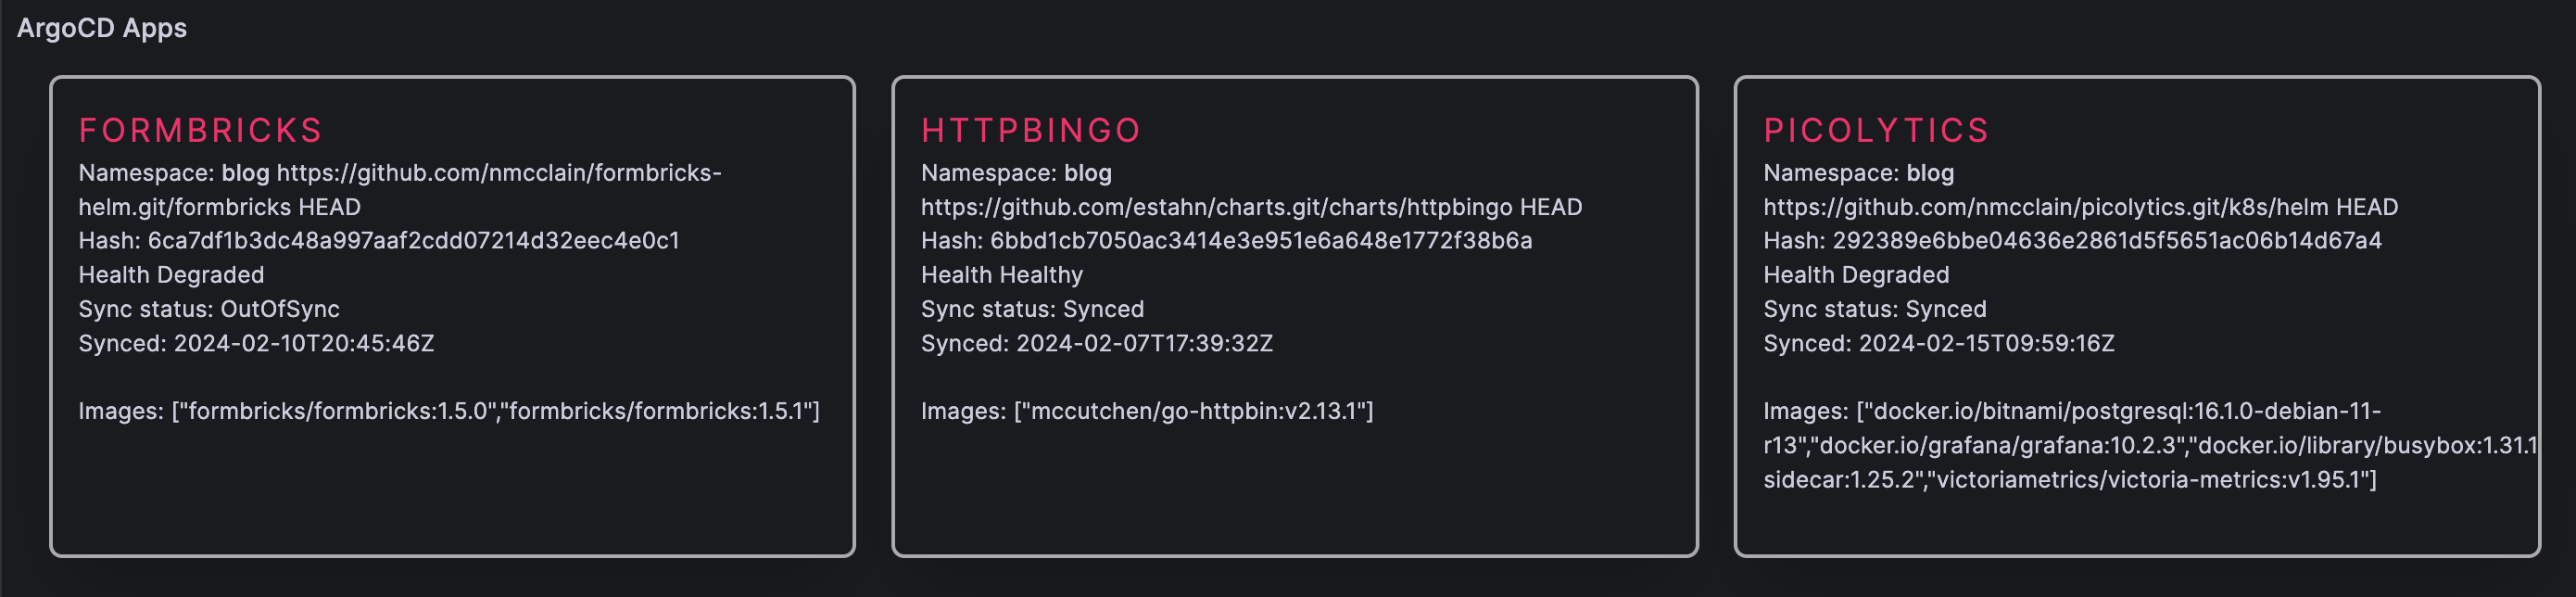
This is easy to do by connecting a JSON datasource for Grafana to the ArgoCD REST API. Here's what it looks like in your Grafana dashboard:
Implement it yourself in these four steps:
1. ArgoCD role and JWT
To allow Grafana to access the ArgoCD API, you must create a Project Role and issue it a JWT.
It's always a good idea to avoid the default project in ArgoCD. You should create deliberate projects that are security-scoped to only the necessary source repos, destination clusters, and cluster resources.
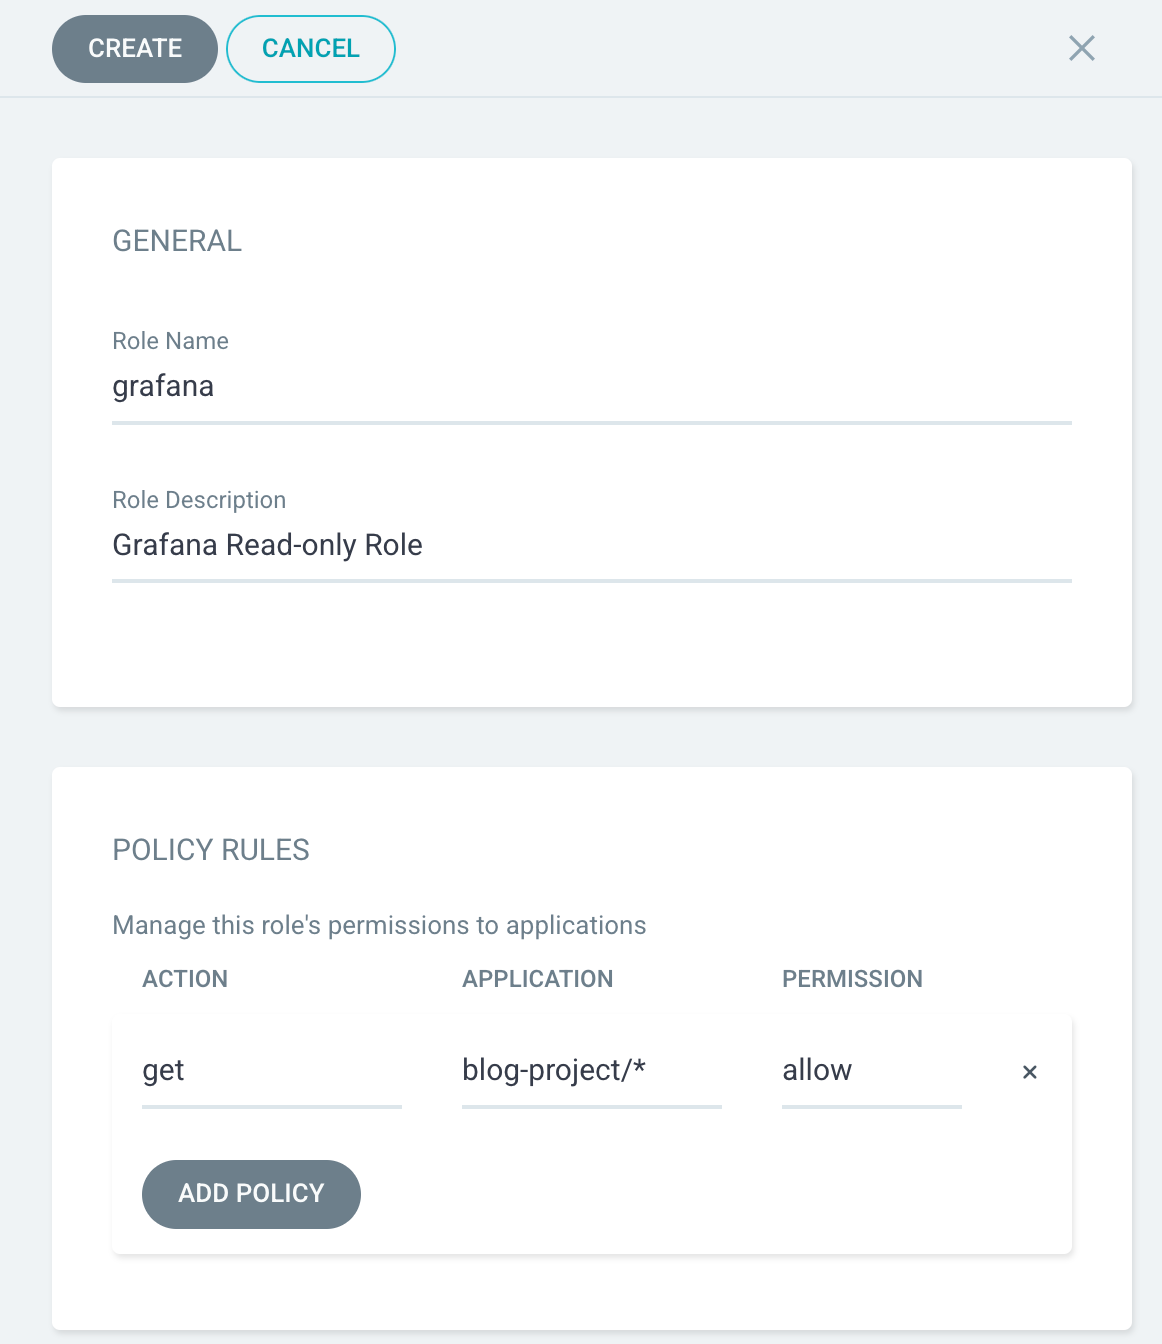
Inside the desired project, click the Add Role button. There, you can populate a new role with read-only permissions. Use your project name in place of blog-project below:
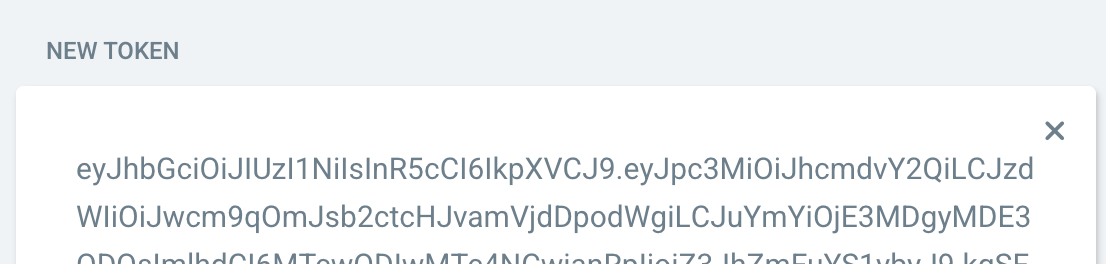
Now you can issue a JWT for this role, which will be used by Grafana. Click your new role, scroll to the bottom, then create a token. Use an expiry if appropriate for your organization's policies.
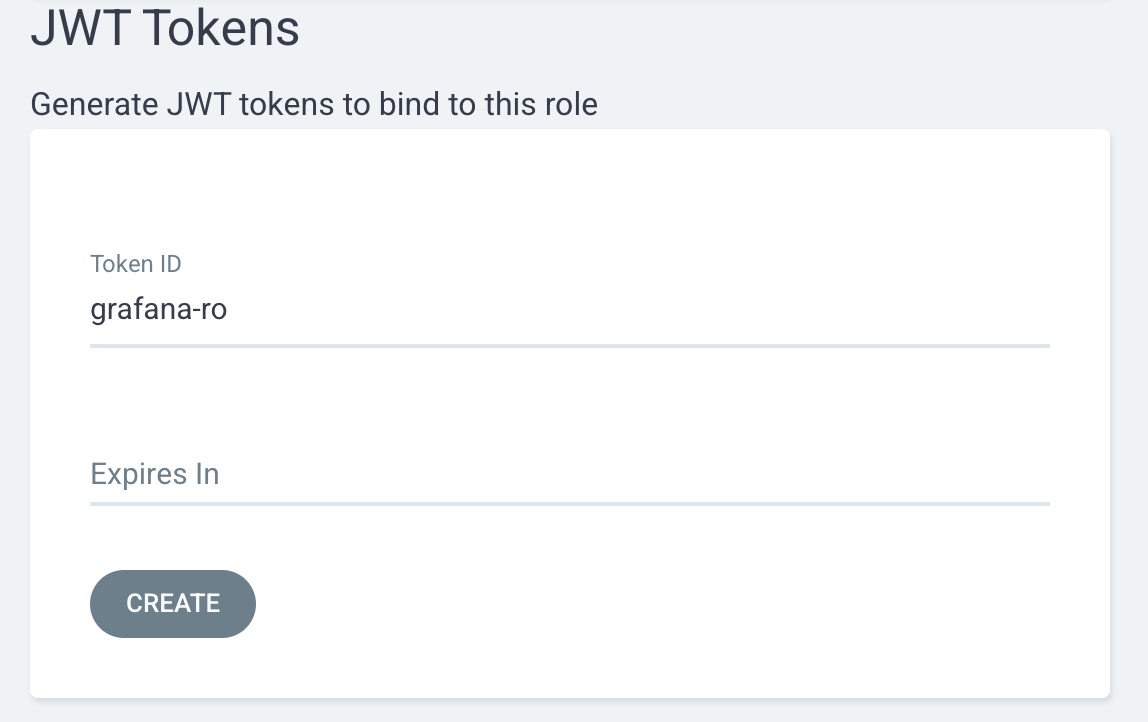
Scroll down to see the new token. Save this for Step 3 - you won't be able to see it again.
2. Install Infinity data source plugin
The Infinity plugin for Grafana can read data from a variety of sources, including ArgoCD's JSON API responses. There are three ways to install it:
- Using the CLI, run:
grafana-cli plugins install yesoreyeram-infinity-datasource - In the Helm chart, add
- yesoreyeram-infinity-datasourcetografana.plugins. - From the web UI:
- Click on
Administration -> plugins. - Switch
statefromInstalledtoAll, then search for "infinity". - Click on "Infinity, by Sriramajeyam Sugumaran".
- Click the "Install" button in the top-right corner.
- Click on
3. Configure Infinity data source
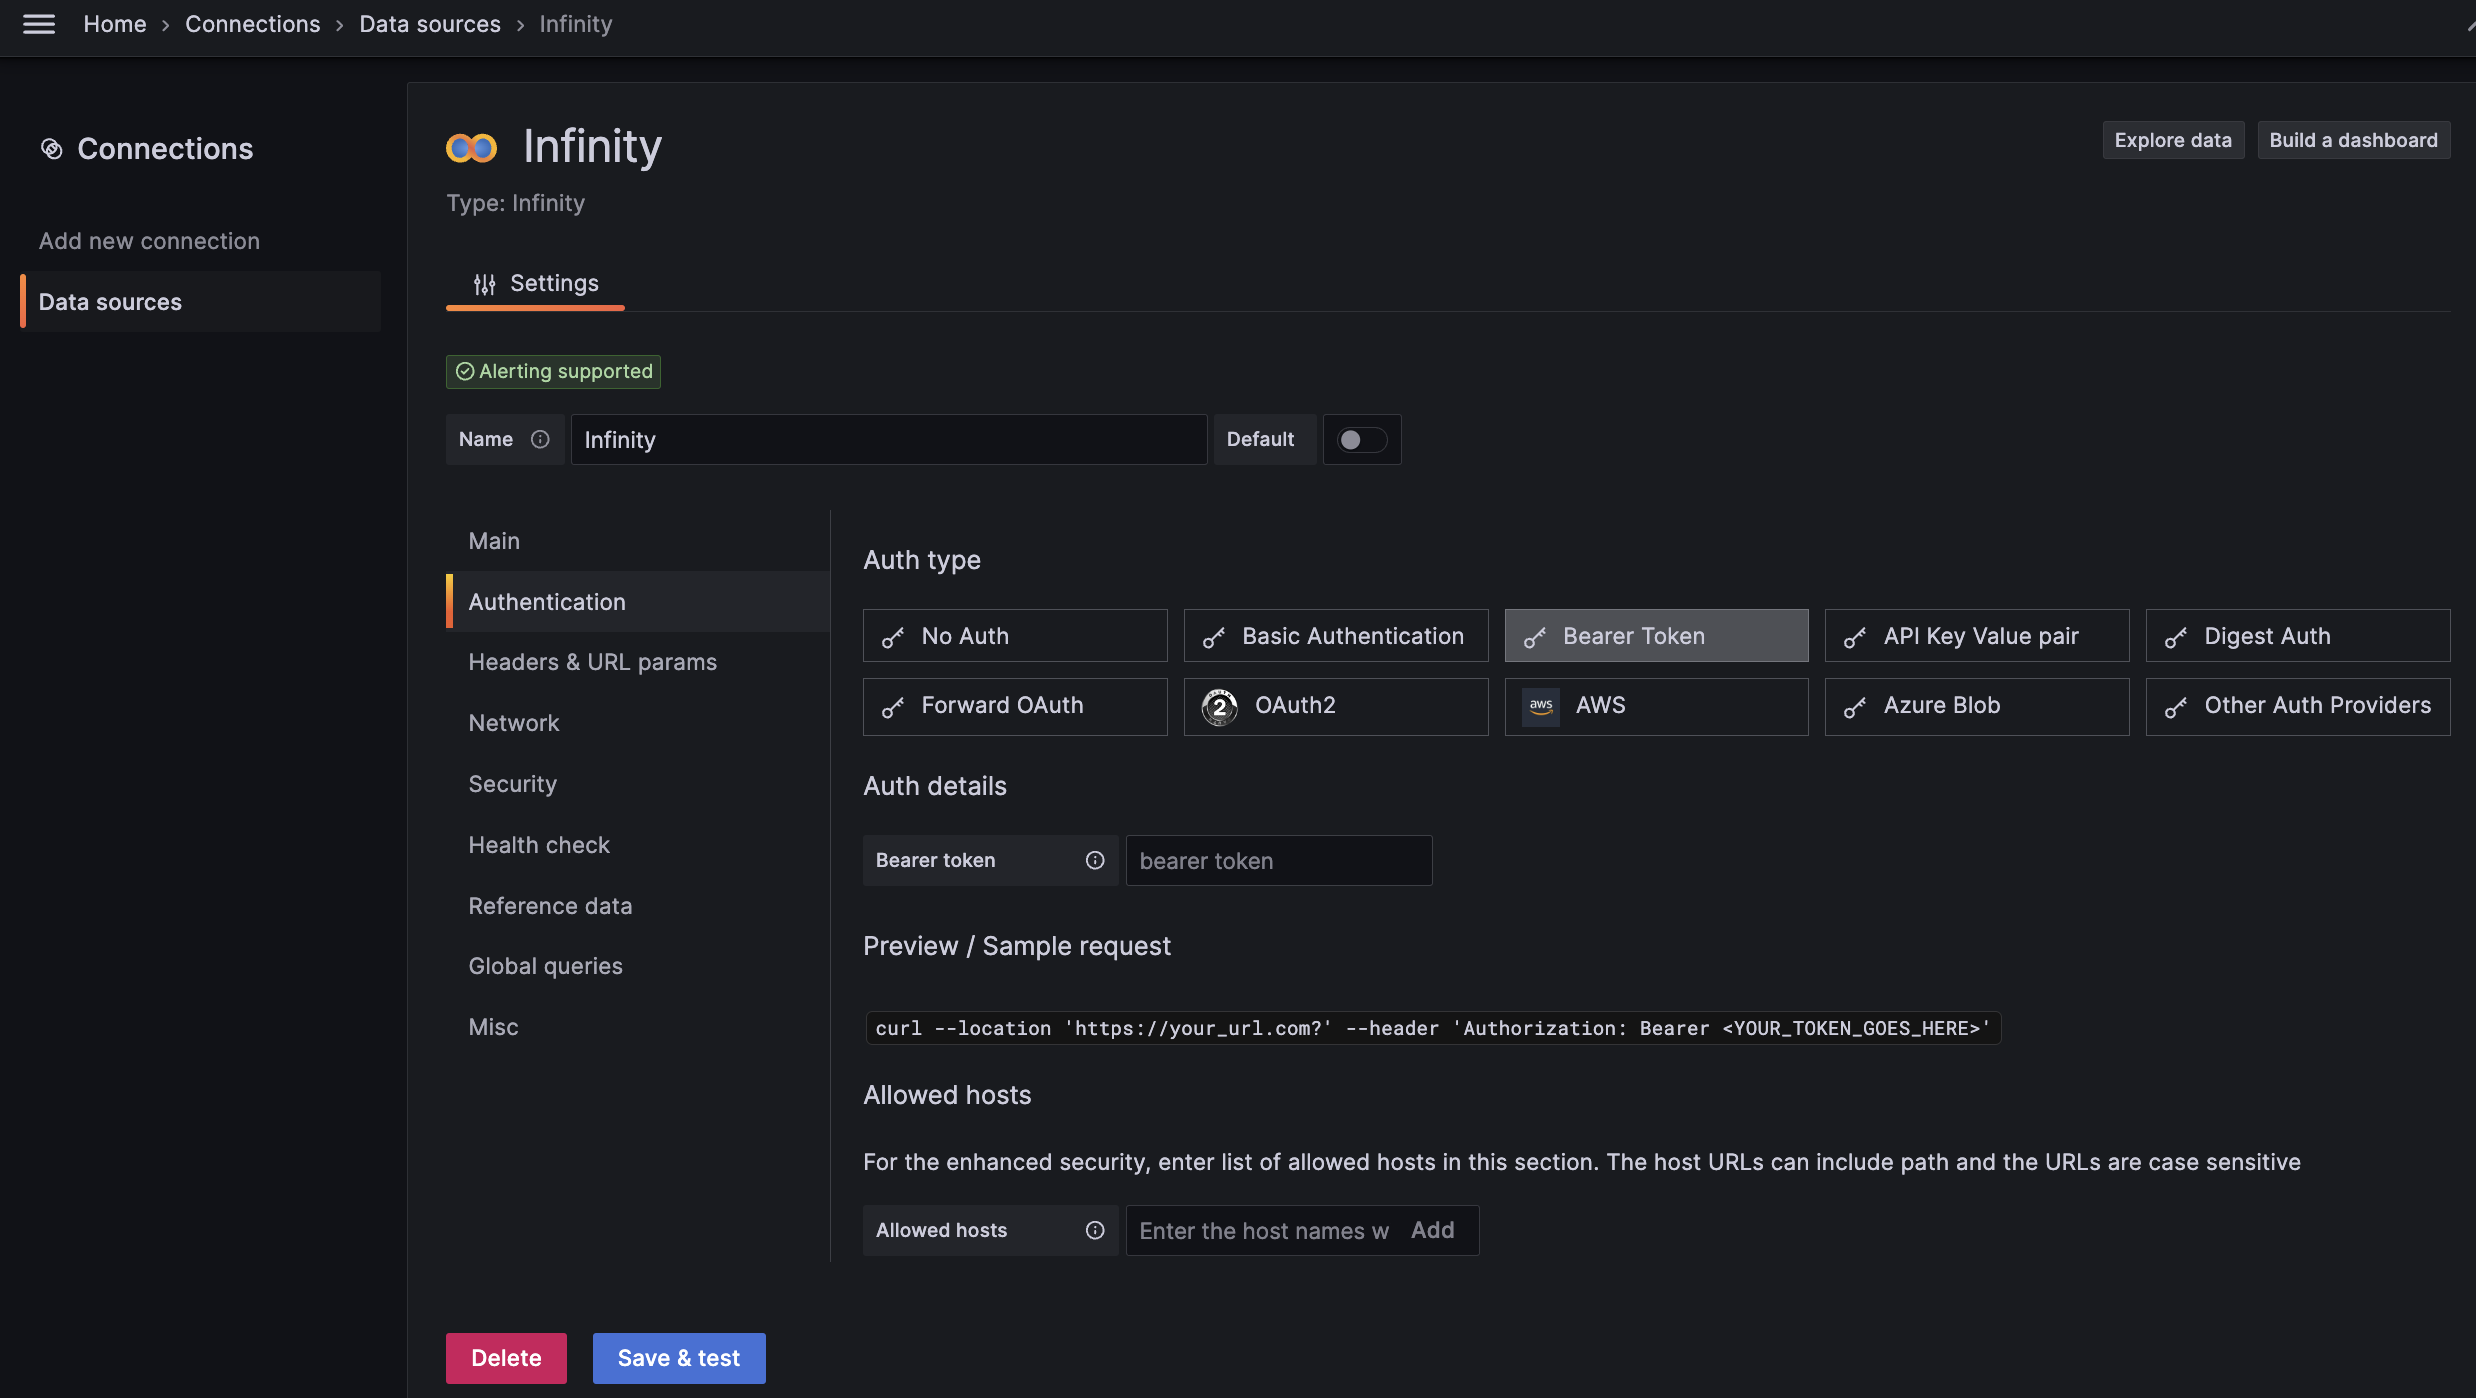
- In the web UI, navigate to
Connections -> Add new connectionand click on "Infinity". - Click the
Add new data sourcebutton. - Click the
Authenticationtab, then pickBearer Token. We'll use the JWT from our ArgoCD as a Bearer token in the Authentication header - paste it here.
- Add your ArgoCD Server URL under
Allowed hosts. Since this example is deployed to Kubernetes, and both Grafana and ArgoCD are in the same namespace, I simply usedhttps://argocd-server.
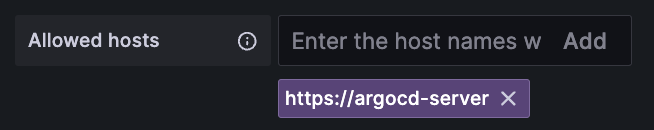
- Click the blue
Save & Testbutton.
4. Panel setup
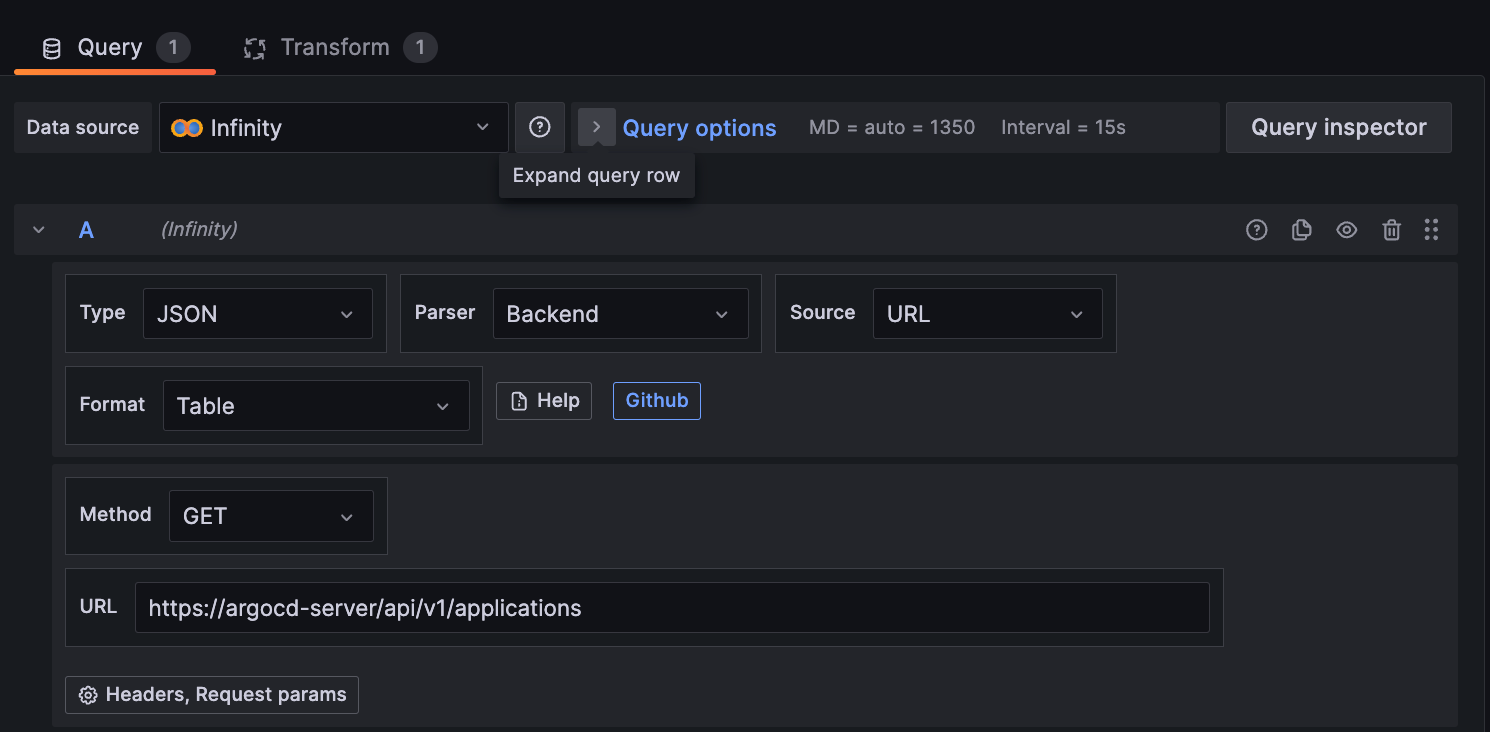
- Finally, go to your dashboard (or create a new one) and add a new panel.
- Pick the
Tablevisualization type (although you can experiment with others likeStateandGauge). - Select the
Infinitydatasource you configured in step 3, set:Type=JSON, Parser=Backend, Source=URL, Format=Table, Method=GET, and adjust theURLtohttps://YOUR-argocd-server/api/v1/applications:
- If the connection to ArgoCD is working, you should see some messy JSON in your table. To parse it, click
Parsing options & Result fieldsand add this JSON selector to theRows/Rootfield:$[].items
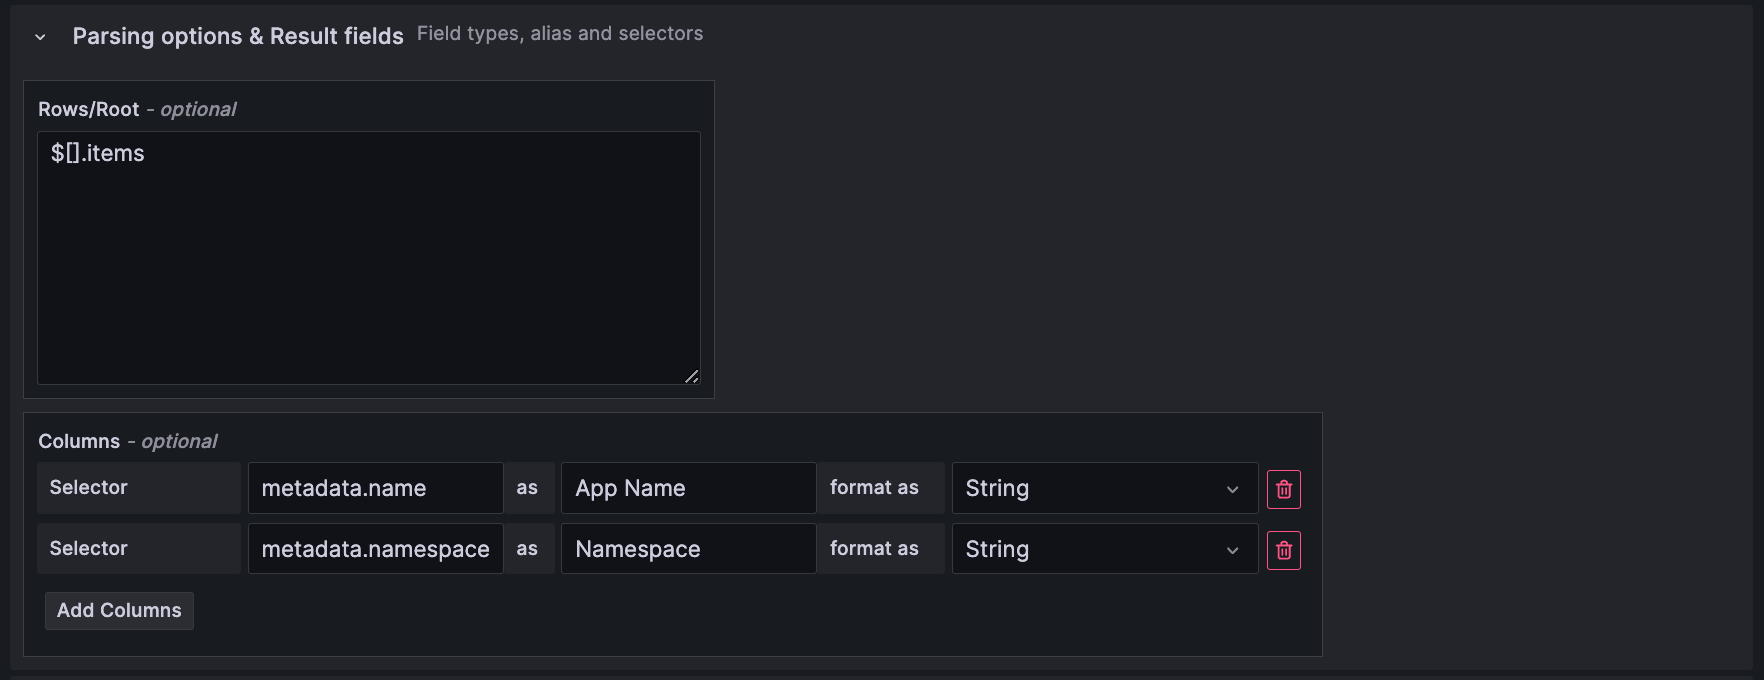
- Now you can
Add Columnswith the JSON selector and column titles you want. Here are some examples:
metadata.name
metadata.namespace
status.health.status
status.history.0.revision [git hash]
status.operationState.finishedAt
status.operationState.message
status.operationState.syncResult.source.path
status.operationState.syncResult.source.repoURL
status.operationState.syncResult.source.targetRevision [git branch or tag]
status.summary.images
status.sync.status- Click
Apply, save your dashboard, and enjoy!
Other Quick Wins
For a more visually pleasing display, consider the Dynamic Text Panel maintained by the fine folks at Volkov Labs. This panel will layout the ArgoCD JSON data using HTML or markdown.
If you're not collecting ArgoCD metrics yet, do it! Using the ArgoCD helm chart, you need to set this value to enable the metrics exporter: controller.metrics.enabled: true.
Then, configure your Prometheus or VictoriaMetrics instance to scrape the ArgoCD endpoint. When using the ArgoCD Helm chart, you can choose to either enable ServiceMonitor resources (preferred) or Prometheus scrape annotations and these services will be automatically discovered.
It's also worth enabling the API, Repo Server, and Dex metrics endpoints. They expose details about requests to the Redis backend, git repositories, the authentication server. Set these Helm values to enable all metrics:
dex.metrics.enabled: true
redis.metrics.enabled: true # or see values file if using redis-ha
server.metrics.enabled: true
repoServer.metrics.enabled: true
applicationSet.metrics.enabled: true
notifications.metrics.enabled: true
Finally, Kubernetes labels on ArgoCD Applications can be optionally converted to Prometheus labels. This is super-useful for breaking down dashboards and alerts based on app owners, projects, etc. You need to specify the list of labels that are meaningful to your org. The key reason to not include certain labels is if they are high-cardinality, like a node identifier or git hash. Set these Helm values:
controller:
  metrics:
    enabled: true
    applicationLabels:
      enabled: true
      labels: ["business_unit", "team_name"]
Alerts
In my experience, alerts are 10x as valuable as dashboards. It'd be an easy choice if I could only pick one. This could be a blog post on its own, but here are a few quick tips:
- Setup ArgoCD notifications to create Grafana annotations when new App versions are deployed.

- Sources for example ArgoCD Prometheus alert rules: Awesome Prometheus Alerts and ArgoCD Grafana Mixin rules by Adin Hodovic.
- Consider alerting more on SLO-driven error budgets rather than individual infrastructure components [see: Google SRE book, workbook].
- Make a thoughtful organizational decision of where alert rules will live. Grafana-native alerts have the benefit of an amazing UI, but Prometheus alerts can be managed with IaC and have a better HA story.
IaC
All of this Grafana and ArgoCD configuration can be captured as code, with one exception: creating the JWT key in ArgoCD. For this you must use the UI or API.
For Helm users, here are some simple examples used for this post:
- Create an ArgoCD project with a grafana-read-only role. You must also manually provision a JWT for this role and add it to the bottom of
helm/templates/grafana-datasource-argocd.yaml. - Enable all ArgoCD metrics endpoints with applicationLabels.
- Create an ArgoCD Application for testing.
- Provision Grafana dashboard.json files from a directory. For this, you must configure a dashboardProvider and ConfigMap.
- Provision Grafana Infinity Datasource. This requires installing the plugin and enabling the datasources sidecar.
- Deploy VictoriaMetrics, a high-performance/lower-resource Prometheus alternative.
If you're not using Helm, this Grafana blog post outlines ways to deploy dashboards and datasources "as code," including with Terraform, Ansible, Crossplane, and the Grafana Operator for Kubernetes.
Alternative Approach
ArgoCD's web dashboard is rich with data. Why do we care to display it in Grafana? Often, stakeholders will already have access to Grafana, but not ArgoCD or kubectl.
If that's not the case in your world, it might make sense to display some basic metrics directly in ArgoCD instead. Use the ArgoCD Metrics Extension to achieve this.
Closing Thoughts
When you say "Grafana," most people think "metrics". Or maybe "metrics, logs and traces". But the truth is there are dozens of amazing Grafana data sources that can be used to pull in data from across your tech ecosystem.
Does your app have an admin API? By all means use Grafana to build alerts to make that data actionable. Got some SalesForce in your world? Pull in critical data via JSON to display in your dashboards. Correlate infra-level metrics with business ones.
I hope this post inspires you to think outside the box when it comes to having all your data visible in one place.
If you're seeking a partner to assist your Platform, DevOps, or SRE team with tough problems, I'm focused where software, infrastructure, and culture intersect. Get in touch here!
Cover photo: Ames power station, Ophir, Colorado - influence from Nunn, Westinghouse, and Nikola Tesla. Via: Jay8g on Wikipedia.