Humans' ability to adapt to technological change is increasing, but it is not keeping pace with the speed of scientific & technological innovation. To overcome the resulting friction, humans can adapt by developing skills that enable faster learning & quicker iteration & experimentation. – Astro Teller
Databases hold a special place in the hearts of operations folks. Usually, not a place of love. Stateful services are challenging to operate. Data is "heavy." You only get two of the following three essential guarantees: consistency, availability, and partition tolerance.
Databases take 10x or more effort to operate in production than stateless services.
Analytics databases have even more unique operational challenges. "Data lakes" are typically massive in scale and demand "interactive" query performance. The queries they service are fundamentally different from what a relational database sees. Analytics is all about fast queries against big data that grows continually but never changes.
I've spent the past couple years working with ClickHouse, and it is my number one tool for solving large-scale analytics problems. ClickHouse is blazing fast, linearly scalable, hardware efficient, highly reliable, and fun to operate in production. Read on for a rundown of ClickHouse's strengths and recommendations for production use.
Quick Jump to a Section
Rule of DevOps: Default to Postgres or MySQL
I must repeat a cardinal rule of DevOps before extolling the virtues of ClickHouse: Default to Postgres (or MySQL). These databases are proven, easy to use, well understood, and can satisfy 90% of real-world use cases. Only consider alternatives if you're pretty sure you fall into the 10%.
Big data analytics is one use case that falls into that rare 10%. ClickHouse might be a good fit for you if you desire:
- Rich SQL support, so you don't have to learn/teach a new query language.
- Lightning-fast query performance against essentially immutable data.
- An easy-to-deploy, multi-master, replicated solution.
- The ability to scale horizontally across data centers via sharding.
- Familiar day-to-day operations and DevOps UX with good observability.
What Makes ClickHouse Different
ClickHouse is a column-store database, optimized for fast queries. And it is fast. The ClickHouse team boldly (and accurately) claims:
"ClickHouse works 100-1,000x faster than traditional approaches."
Traditional databases write rows of data to the disk, while column-store databases write columns of data separately. For analytics queries, the column-store approach has a few key performance advantages:
- Reduced disk IO: Analytics queries often focus on a handful of columns. Traditional databases must read each row, with all its columns, off the disk. A column-store database reads only the relevant columns from disk. With high-cardinality analytics databases, disk IO is reduced by 100x or more. In general, disk IO is the primary performance bottleneck for analytics, so the benefit here is tremendous.
- Compression: By nature, each column stores very similar data. Imagine a food preference field allowing
any,vegan, andvegetarian. Compressing a file with three repeating values is incredibly efficient. We get about 20x compression in a large production ClickHouse environment I help manage. Highly compressed data means even less disk IO. - Data locality: The image below shows traditional row storage on the left and column storage on the right. The red blocks in the image below represent data from a single column. With a high-cardinality analytics query, reads are mostly contiguous instead of spread across the disk. These queries work hand-in-hand with the OS's read-ahead cache.

Let's look at a simple dining_activity database table. We'll use it to track who's eating the most food the fastest, and maybe encourage them to go for a jog.
CREATE TABLE dining_activity (username text, food_eaten text, ounces int, speed int, dined_at date) ...On the left, you can see that MySQL stores the entire table's worth of data in a single file on disk. ClickHouse, on the right, stores each table column in a separate file. This is the essence of a column-store database.

ClickHouse is purpose-built for Online Analytical Processing (OLAP), not Online Transaction Processing (OLTP). It is designed for analysis of immutable data, such as logs, events, and metrics. New data arrives all the time, but it is not changed.
⚠️Do not use ClickHouse where you need frequent UPDATEs or DELETEs. ClickHouse provides fast writes and reads at the cost of slow updates.
NOTE: ClickHouse does support UPDATE and DELETE queries, but only with eventual consistency. These operations are slow due to ClickHouse's MergeTree implementation. This feature is useful for GDPR compliance, for example, but you can be sure your transactional app just won't work well.
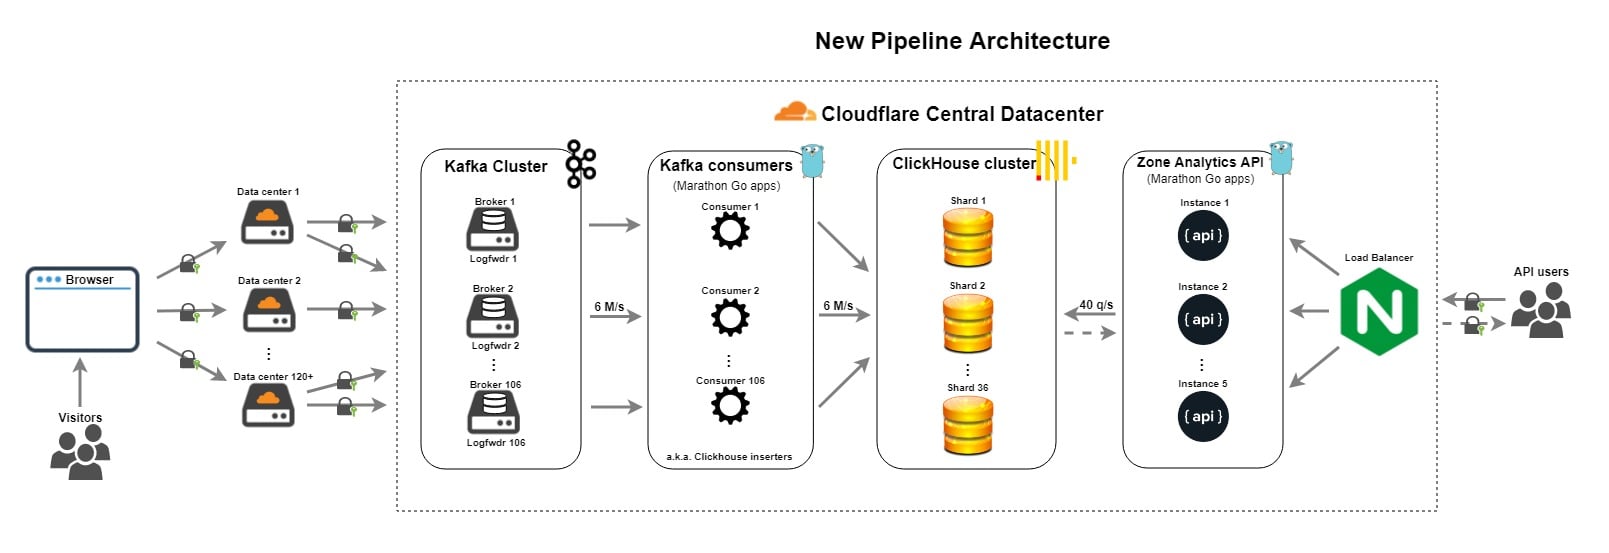
Ultimately, the column-store architecture is faster and more cost-effective for analytics use cases. The CloudFlare team shares their success with ClickHouse in the article below.
A Note About RedShift
AWS RedShift is an excellent hosted solution; I have used it successfully for several projects. As a traditional RDBMS, it supports transactional and analytics applications. If you need a mostly Postgres-compatible analytics database and cost is no issue, definitely consider RedShift.
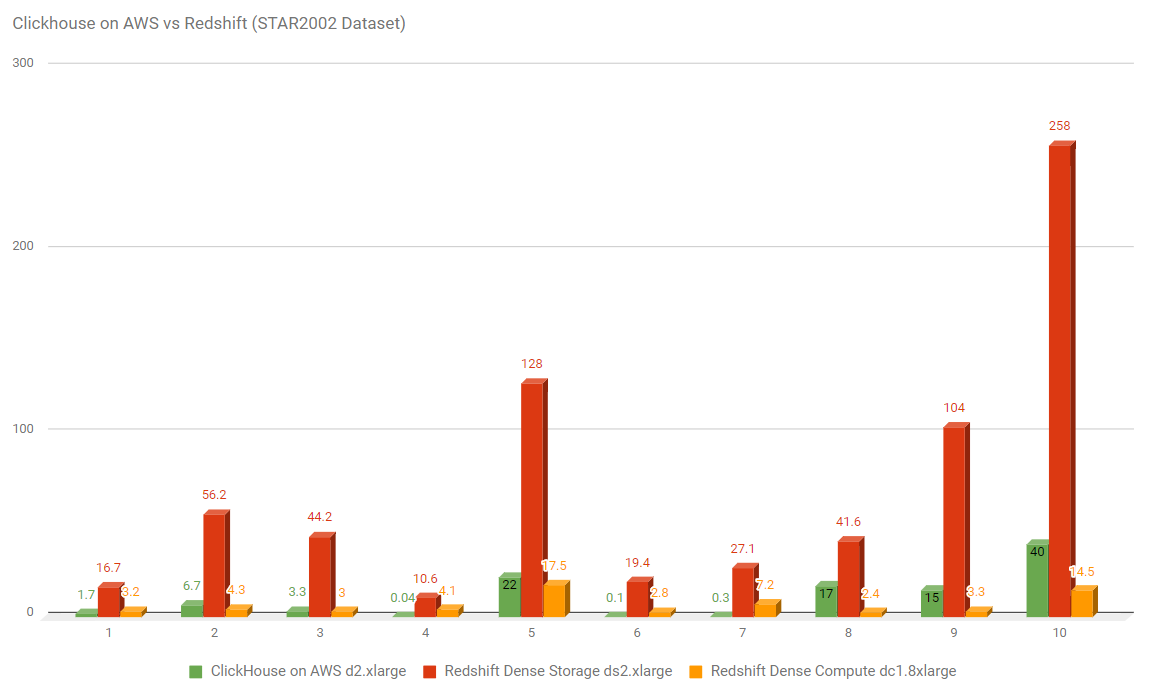
On the other hand, this Altinity benchmark helps to demonstrate ClickHouse's impressive performance/cost ratio. The server supporting the green ClickHouse bars costs about $190 per month. The servers supporting the red and orange RedShift bars below cost about $650 and $4,100 per month, respectively. Compared to RedShift on a ds2.xlarge server, ClickHouse offers ~10x better performance at roughly a 30% cost savings.
Key use cases where ClickHouse may be a better fit than a Postgres cluster like RedShift include:
- Non-transactional use: Based on Postgres, RedShift can support both analytics and transactional use cases. ClickHouse does not support the latter, so it's only appropriate for analytics use cases.
- Geographic sharding: RedShift is designed to be deployed in a single AWS Region. Compliance requirements or the performance desire to serve content close to your users may drive you toward ClickHouse.
- Capital matters: You will spend more on both compute and storage with a RedShift cluster for equivalent analytics performance.
What about GCP's BigQuery? BigQuery is an outstanding solution for non-interactive analytics. However, I have not seen evidence that it performs fast enough for "interactive" analytics use. It is typical for BigQuery to take more than a few seconds to return results.
Why DevOps ❤️ ClickHouse
ClickHouse is close to perfect for both data scientists and operations people. It is easy to use, manage, observe, scale, and secure. With SQL and ODBC support, it's an equally powerful analytics back end for both developers and non-technical users.
This section explores ClickHouse's unique characteristics and includes recommendations for using ClickHouse in production. Already convinced that ClickHouse might be useful? Please bookmark this for when you are ready to move to production!
Usability
The practice of DevOps values business impact and ultimately, the end user, above all else. We want to provide services that are easy to digest.
It's unreasonable to ask your analysts and data scientists to learn a new query language. They expect and deserve SQL. Their tools and training are going to fall over if you build a MongoDB analytics solution, and they have to start doing this:
db.inventory.find( { $or: [ { status: "A" }, { qty: { $lt: 30 } } ] } )
ClickHouse works well with graphical data analysis tools because it supports a fairly standard dialect of SQL. It also includes a bunch of non-standard SQL functions specifically designed to help with analytics.
Support for ODBC means ClickHouse works great with familiar tools such as Tableau, Power BI, and even Excel.
For even less technical users, start them off on the right foot with a web-based analysis tool:
- Grafana can speak to ClickHouse and it produces visually stunning dashboards.
- The Tabix web UI was built explicitly for ClickHouse. In addition to data exploration, query building, and graphing, Tabix has tools for managing ClickHouse itself.
- Redash sports similar features to Tabix but with richer functionality. It can pull data from a variety of sources besides ClickHouse, merging results into reports and visualizations.
- ClickHouse empowers many other commercial and open source GUI tools.
To the developer audience, ClickHouse has libraries for your favorite language, including Python, PHP, NodeJS, and Ruby, among others. As a picky Go developer, it has been a pleasure using the clickhouse-go library to talk to ClickHouse.
Want to use ClickHouse but don't want to update your code? Java developers will appreciate native JDBC support. Others will find the native MySQL interface works with their language's standard MySQL library. It speaks the MySQL wire protocol and is mighty fast.
Data scientists will be right at home with ClickHouse's support for Python Jupyter Notebooks. Jupyter is the standard workflow tool for statistical analysis and machine learning. Accessing ClickHouse data from Jupyter is a breeze with the clickhouse-sqlalchemy Python library.
Operators will love the fact that ClickHouse has a standard CLI clickhouse-client for interacting with the database. It works a lot like MySQL's mysql and Postgres' psql commands. It feels familiar.
And oh yeah, ClickHouse has some pretty great documentation.
Finally, ClickHouse exposes an HTTP interface. It makes doing a server health check as simple as:
$ curl http://localhost:8123
Ok.
You can even run queries with curl:
$ curl 'http://localhost:8123/?query=SELECT%20NOW()'
2020-02-15 20:10:21
Data Management
The libraries mentioned above allow you to integrate ClickHouse with your custom software. This affords infinite flexibility but is certainly not required to get data into ClickHouse for analysis.
The clickhouse-client CLI has a simple way to load bulk data from files. It supports basic formats like CSV, TSV, and JSON. It also supports many modern data formats such as Apache Parquet, Apache Avro, and Google's Protobuf. Using one of these newer formats offers enormous advantages in performance and disk usage.
Of course, you can also use the clickhouse-client CLI to export data in each of these formats.
We looked at ClickHouse's ability to act as an ODBC server above. ClickHouse can also act as an ODBC client. ClickHouse will ingest data from an external ODBC database and perform any necessary ETL on the fly. It can do the same for external MySQL databases and JDBC database endpoints. ClickHouse also has a SQL abstraction over existing HDFS volumes, making Hadoop integration easy.
There are several off-the-shelf solutions for streaming data into ClickHouse. With built-in support for Apache Kafka, ClickHouse can publish or subscribe to Kafka streams. This fits nicely in existing Kafka streaming architectures and works well with AWS MSK. A third-party library exists to stream data from Apache Flink into ClickHouse. Have an existing ClickHouse deployment? The clickhouse-copier tool makes it easy to sync data between ClickHouse clusters.
Let's face it: System and application logs are a prime candidate for ClickHouse data. An agent can forward those logs to your database. One option is clicktail, which was ported from Honeycomb.io's honeytail to add ClickHouse support. Another old favorite is LogStash. You'll need to install the logstash-output-clickhouse plugin, but then you'll be able to write logs directly to ClickHouse.
Backups, restore, and disaster recovery are thankless tasks for operators. Analytics databases are particularly tricky because they are too big to just dump to a single backup file. It helps to have tools that are easy to use and scale well.
ClickHouse provides just the right tools for this need. Table data gets split up on disk into "parts," each managed independently. It's easy to "freeze" a part, and save the "frozen" files using rsync, filesystem snapshots, or your favorite backup tool. You can specify how parts are created based on your use case: Your parts could hold a week's worth of data, or an hour's worth. This abstraction makes managing Petabyte-scale data sets possible.
There are also some friendly safeguards built into ClickHouse, focused on preventing human error. You must jump through an extra hoop, for example, when dropping tables over 50 GB. I embrace this feature with open arms.
Deployment
ClickHouse scales handily, from your laptop to a single server to a globally distributed cluster. Get familiar with the server, client, and configuration on your workstation. All of those skills will transfer to production.
ClickHouse is written in C++ and supports Linux, MacOS, and FreeBSD. DEB and RPM packages make installation easy. You should be aware of Altinity's Stable Releases. ClickHouse is moving fast, sometimes breaking things, and I've encountered some serious problems using the latest "release" from GitHub. Be sure to use one of Altinity's recommended releases for production use.
The ClickHouse docker container is easy to use and well maintained. It's a great way to experiment locally, or deploy into your containerized environment. At Kubernetes shops, clickhouse-operator will get you up and in production in no time. It will manage your K8s storage, pods, and ingress/egress configuration. Just run:
kubectl apply -f https://raw.githubusercontent.com/Altinity/clickhouse-operator/master/manifests/operator/clickhouse-operator-install.yamlAnsible admins can get a head start with this ansible-clickhouse role.
Finally, the corporate sponsor of ClickHouse offers a managed ClickHouse in the cloud. I note it here to be complete but have not used it personally. I suspect we won't see an AWS-managed ClickHouse anytime soon. It could undercut RedShift revenue!
Availability
This section is short. High availability is easier with ClickHouse than any other database I've ever used. Except for DNS, of course :)
Replication guarantees that data gets stored on two (or more) servers. ClickHouse's painless cluster setup is one of my favorite features as an operations person. Replication is trivial to configure: You need a Zookeeper cluster and a simple config file.
If you've ever set up a Postgres/MySQL cluster, you know it's no fun. Configuring replication involves a careful sequence of manual steps: locking the tables (impacting production), quiescing the database, noting the binlog location, snapshotting the volume, unlocking the tables, rsync'ing the binlogs to the follower, loading the binlogs on the follower, setting the binlog location on the follower, starting replication, etc... With ClickHouse, this is almost entirely automatic.
Instead of the standard master/follower model used by Postgres and MySQL, ClickHouse's replication is multi-master by default. You can insert new data into any replica, and can similarly query data against any replica. The multi-master architecture saves the need to front your database with load balancers. It also eases client configuration and saves your developers time and effort.
The Zookeeper dependency mentioned above is the only real cost of using ClickHouse's replication. That's three more servers (or pods) you must deploy, patch, and observe. Zookeeper is pretty low maintenance if it's set up correctly. As the documentation says, "With the default settings, ZooKeeper is a time bomb." Looking for a slightly more modern alternative? Check out zetcd from CoreOS.
Performance and Scalability
Play with ClickHouse for a few minutes and you'll be shocked at how fast it is. An SSD-backed server can query several GB/sec or more, obviously depending on many variables. For example, you might see queries achieve 20 GB/sec, assuming 10x compression on a server with SSD that can read 2 GB/sec.
Detailed ClickHouse performance benchmarks are provided here.
Single-server performance is fun to explore, but it's fairly meaningless at scale. The service must be able to scale "horizontally," across dozens or hundreds of individual servers.
It uses a cluster of 374 servers, which store over 20.3 trillion rows in the database. The volume of compressed data, without counting duplication and replication, is about 2 PB. The volume of uncompressed data (in TSV format) would be approximately 17 PB. - ClickHouse use at Yandex
Yandex operates ClickHouse at this scale while maintaining interactive performance for analytics queries. Like other modern databases, ClickHouse achieves massive horizontal scaling primarily through sharding.
With sharding, servers store only a subset of the database table. Given two servers, one might store records starting with A-M while the other stores records for N-Z. In practice, ClickHouse uses a date/time field to shard data.
With ClickHouse, database clients don't need to know which servers will store which shards. ClickHouse's Distributed Tables make this easy on the user. Once the Distributed Table is set up, clients can insert and query against any cluster server. For inserts, ClickHouse will determine which shard the data belongs in and copy the data to the appropriate server. Queries get distributed to all shards, and then the results are merged and returned to the client.
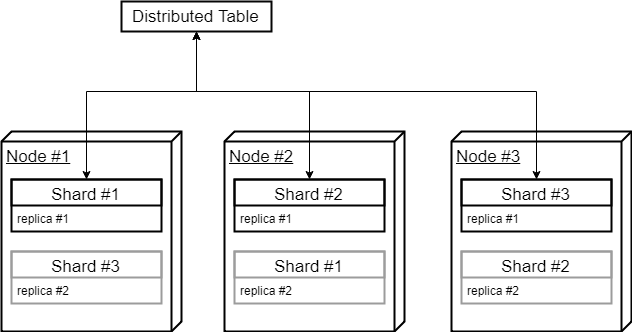
Sharding allows for massive horizontal scaling: A sharded table can be scaled out to hundreds of nodes, each storing a small fraction of the database.
Here are a few more performance tips:
- Materialized views. Instruct ClickHouse to perform aggregation and roll up calculations on the fly. Materialized views are the secret to making dashboards super-fast.
- User-level quotas. Protect overall performance by limiting user impact based on # of queries, errors, execution time, and more.
- TTLs for data pruning. It's easy to tell ClickHouse to remove data after some lifetime. You can set Time-To-Live for both tables and individual columns. Meet your compliance requirements and avoid DBA effort with this feature.
- TTLs for tiered data storage. ClickHouse's TTL feature recently added support for moving data between different tiers of storage. For example, recent "hot" data could go on SSD for fast retrieval, with older "colder" data stored on spinning magnetic disks.
- Performance troubleshooting with
clickhouse-benchmark. You can use this tool to profile queries. For each query, you can see queries/sec, #rows/sec, and much more.
⚠️ Don't even think about running ClickHouse in production without reviewing the Usage Recommendations and Requirements pages. They contain essential advice on hardware, kernel settings, storage, filesystems, and more. Use ext4, not zfs.
The standard ClickHouse cluster deployment (replication, sharding, and Distributed Tables) is very effective. It's probably enough for most use cases. For those who desire additional control, CHProxy is gold.
Similar to an HTTP reverse proxy, CHProxy sits in between the ClickHouse cluster and the clients. CHProxy gives you an extra layer of abstraction:
- Proxies to multiple distinct ClickHouse clusters, depending on the input user.
- Evenly spreads requests among replicas and nodes.
- Caches responses on a per-user basis.
- Monitors node health and prevents sending requests to unhealthy nodes.
- Supports automatic HTTPS certificate issuing and renewal via Let’s Encrypt.
- Exposes various useful metrics in Prometheus format.
Importantly, CHProxy can route clients directly to the appropriate shard. This eliminates the need to use Distributed Tables on INSERT. ClickHouse is no longer responsible for copying data to the appropriate shard, lowering CPU and network requirements.
Use CHProxy to provide universal ingestion endpoints that ship events to wholly distinct ClickHouse clusters. Give certain clients a high-priority cluster. Send client data to a "close" network location, or a compliant geography. Or shunt misbehaving clients to a dedicated cluster (or /dev/null).
Observability
ClickHouse is easy to observe: Metrics are readily available, event logging is rich, and tracing is reasonable.
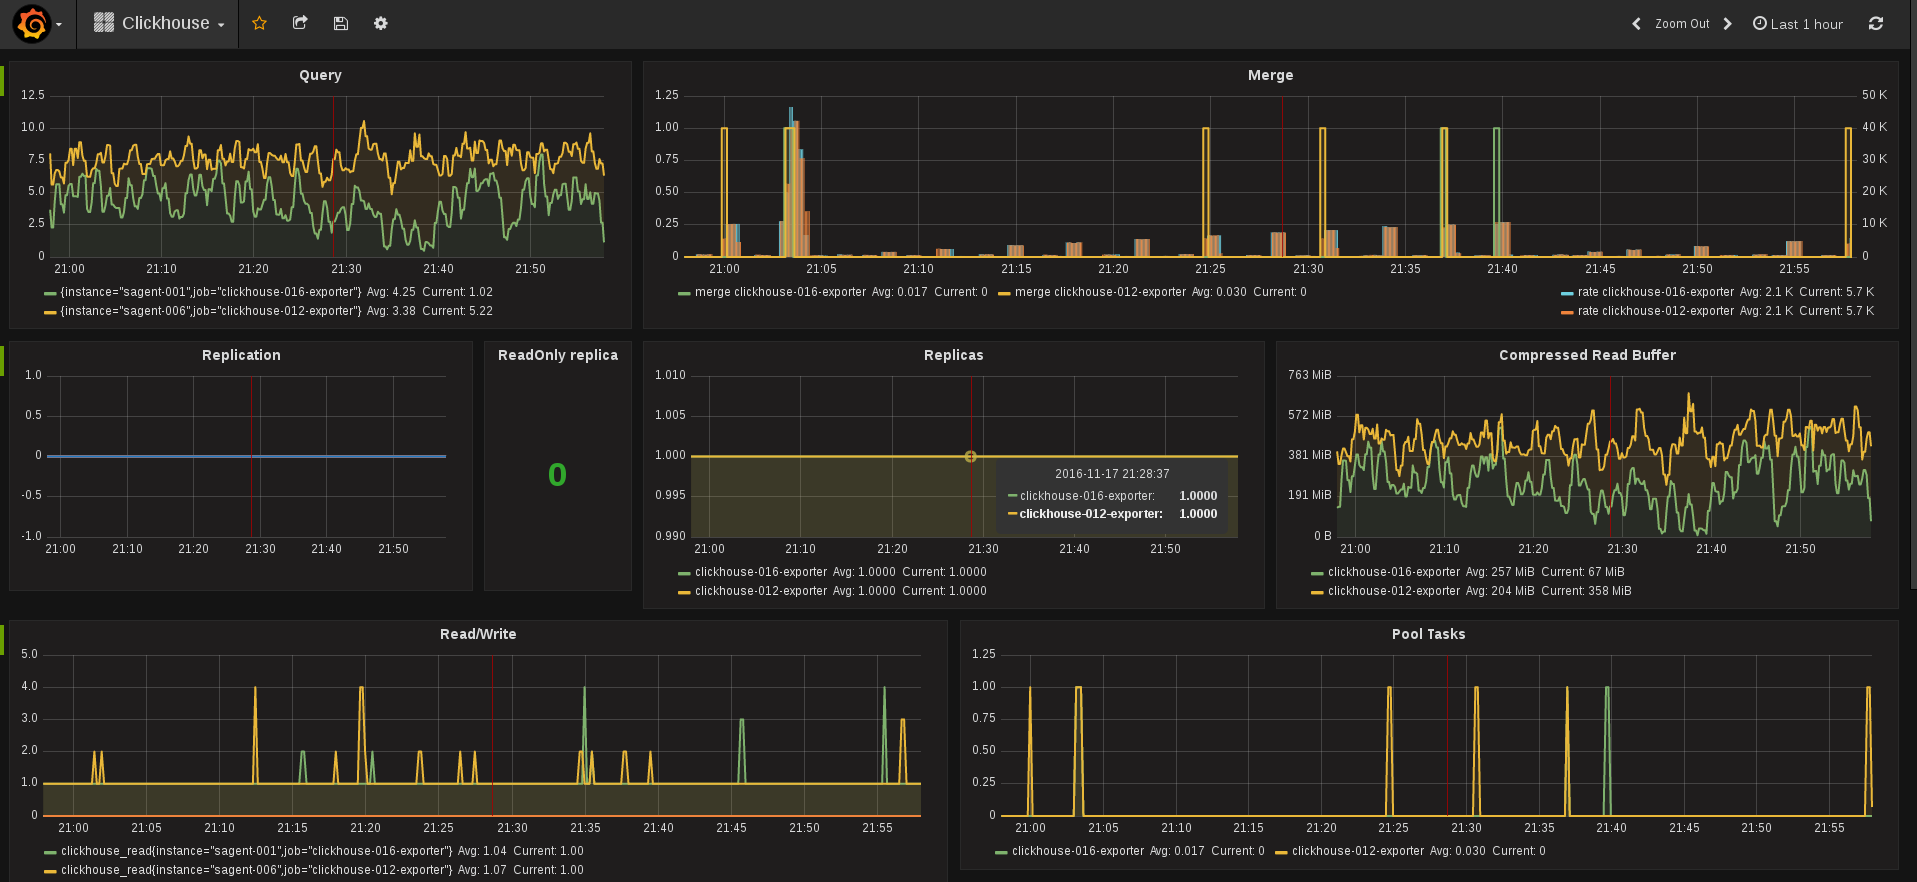
Prometheus is today's standard cloud-native metrics and monitoring tool. The clickhouse_exporter sidecar works great in both containerized and systemd environments.
Prometheus and CHProxy's integration with Grafana means you get beautiful dashboards like this:
ClickHouse supports shipping metrics directly to Graphite. There are also Nagios/Icinga and Zabbix checks for ClickHouse; you don't have to embrace Prometheus.
As mentioned above, a simple GET request to the ClickHouse HTTP endpoint serves as a healthcheck. To monitor replicas, you can set the max_replica_delay_for_distributed_queries parameter and use each server's /replicas_status endpoint. You'll get an error response with details if the replica isn't up to date.
Logging with ClickHouse is good, but not ideal. Verbose logs are provided and contain useful stack dumps. Unfortunately, they are multi-line messages, requiring special processing. JSON-formatted event logs are not an option.
ClickHouse tracing data is stored in a special system table. This approach is far from optimal for your standard log ingestion tool, but it works for troubleshooting specific issues. There has been some discussion about adding OpenTracing support.
Despite the promises of DevOps, production operators still regularly need to troubleshoot individual services. Similar to Postgres, you can introspect ClickHouse using SQL. Internals such as memory utilization, replication status, and query performance are available.
To bookend this section, it's worth noting that ClickHouse also makes a robust back end for storing large-scale Graphite metrics.
Security
Infrastructure folks know HTTP. Securing it is second nature. We have a boatload of proxies, Layer 7 firewalls, caching services, and networking tools to leverage against the HTTP protocol. ClickHouse and CHProxy provide a standard HTTPS endpoint that requires no new infrastructure tooling.
ClickHouse expects you to configure individual users. You could use root for all access, but individual users are supported for those who care about security. You can grant each user access to a list of databases, but there are no table-level controls. Read-only permissions are available, but they apply to all databases the user can access. It's impossible to grant a user read-write access to one database and read-only access to another.
The limitations above may be problematic for some. If you need further control over untrusted users, CHProxy provides it. CHProxy's separate abstraction of users brings its own security and performance controls. Hide ClickHouse database users behind public-facing CHProxy users. Limit per-user query duration, request rate, and # of concurrent requests. CHProxy will even delay requests until they fit in per-user limits, which is perfect for supporting dense analytics dashboards.
ClickHouse for SysAdmins
Sysadmins and DevOps folks will discover one other compelling ClickHouse use case: clickhouse-local as a command-line Swiss army knife.
The clickhouse-local program enables you to perform fast processing on local files, without having to deploy and configure the ClickHouse server.I have used tools like sed, awk, and grep on the command line for several decades. They are simple, powerful tools that can be chained together to solve novel problems. I'll always keep them in my pocket.
Still, these days I often turn to clickhouse-local when scripting or writing bash aliases. It can take tabular output from tools like netstat or ps and run SQL queries against it. You can sort, summarize, and aggregate data in ways that are impossible with traditional tools. Like sed and friends, clickhouse-local follows the Unix philosophy.
Write programs that do one thing and do it well. Write programs to work together. Write programs to handle text streams, because that is a universal interface. – Doug McIlroy, Bell Labs
Add the following to your .bash_profile, and you'll be able to use nettop10 to see the remote hosts with the most connections.
alias netop10=NetstatTopConn
function NetstatTopConn()
{
        netstat -an | egrep '^..p' | awk '{print $1 "\t" $4 "\t" $6}' | clickhouse-local -S 'proto String,raddr String,state String' -q 'select count(*) as c,raddr from table group by raddr order by c desc limit 10 FORMAT Pretty'
}
Sample clickhouse-local alias entry in .bash_profile
There are plenty of other great usage examples in the clickhouse-local docs.
clickhouse-local is also popular with data science folks. It's a blazingly fast way to do quick ad-hoc analysis, and it supports all the file formats discussed earlier. Take a huge CSV or Parquet file and run SQL queries directly against it with clickhouse-local. No server required!
Next Steps
Whether you are a data scientist working on your laptop, a developer, or an operations engineer, ClickHouse deserves a place in your toolbelt. It is lightning fast for analytics use cases, efficient with compute and storage resources, and a pleasure to operate in production.
The key to good decision making is not knowledge. It is understanding. We are swimming in the former. We are desperately lacking in the latter.” ― Malcolm Gladwell
Want to learn more? Check out the ClickHouse QuickStart. The Altinity blog is also a fountain of ClickHouse knowledge.
Are you tackling a data analytics challenge? I'm focused where software, infrastructure, and data meets security, operations, and performance. Follow or DM me on twitter at @nedmcclain.
