Imagine a typical Grafana user: they pull up a shared dashboard, make some improvements, then hit Save dashboard. Later, high-fives abound as the team celebrates this contribution.
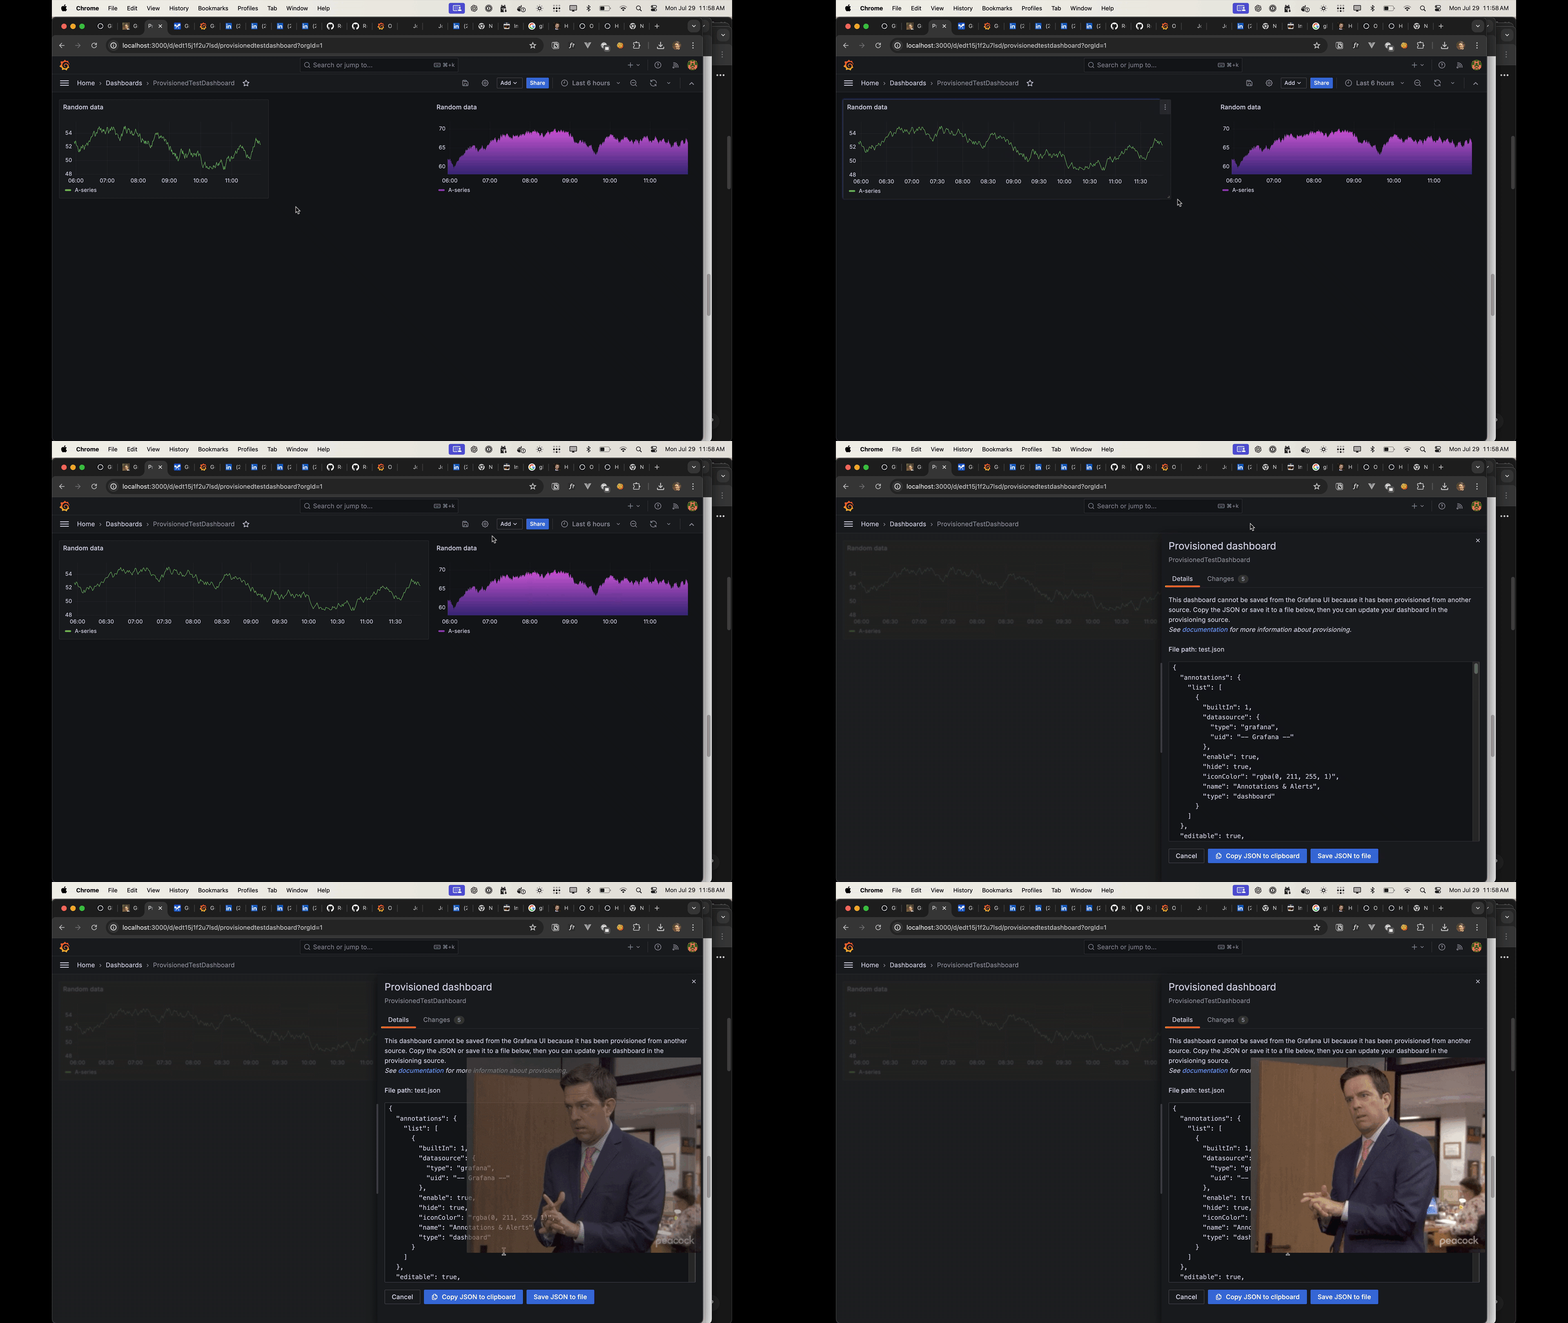
Inspired, our typical user finds another dashboard and invests serious time improving it. However, just as they click Save dashboard a frustrating surprise rears its head:
"This dashboard cannot be saved from the Grafana UI because it has been provisioned from another source."

What did our noble dashboard editor do wrong? Nothing! Thanks to Grafana's intuitive UI, they had no trouble making some awesome improvements, and every reason to believe the Save dashboard button would work just like it did last time.
So, what happened here?
Complex Systems Collide
The whole premise of DevOps is breaking down organizational silos. We desperately want to empower developers, product managers, and even management roles with control over their alerts and dashboards. The best way to do this is through the UI they already use to operate their applications (such as Grafana).
On the other hand, Infrastructure as Code (IaC) is built on the idea that you never directly make changes through a UI or CLI. Usually, IaC tools will detect these changes as "drift" and undo them. This is a key feature - enabling change tracking, self-documentation, and automated rollbacks. IaC is a staple of any modern operations team.
The conflict arises when teams use IaC tools to deploy Grafana dashboards. This results in dashboards that can be edited in the UI, but changes cannot be saved - a frustrating user experience.
If a user needs to make a change to a provisioned dashboard, they must copy dashboard JSON, switch contexts from the Grafana UI to their code repository, paste changes there, then re-deploy. This is a slower feedback loop than direct UI editing.
Worse, this situation yields two classes of dashboards, creating a divide between "developer-managed" and "user-managed" content. User confusion is guaranteed. [1][2][3][4]
What can we do about this?
First, here are the two existing approaches that I've seen work well in production:
- Grafana Enterprise with RBAC and Versioning. It is very reasonable to just throw out IaC and rely on Grafana's built-in application controls: use RBAC to limit changes to trusted users and groups; lean on the "versions" feature for dashboards to track and rollback changes. RBAC requires an Enterprise license, so this may or may not be an option for you.
- GitOps with Manual updates from the Grafana UI: It's definitely possible to copy the dashboard JSON from the UI and paste it into a Git update. This requires editors to remember where to store the updated dashboard [which repository, what file], know how to use
git[for branches, commits, PRs], and that each has write access to the GitOps repository storing the dashboards.
Neither of these feels ideal for an operations team committed to GitOps. How can we get the benefits of IaC for dashboards, while encouraging cross-team collaboration through Grafana's UI?
A Third Way
I propose a new option for saving provisioned dashboards: embrace GitOps by integrating Git support directly into the Grafana UI.
It could look like this:
Proof of concept for new "Create GitHub PR" button.
Here's what happens when you click the new Create GitHub PR button:
- Your dashboard changes are stored in a DevOps-specified GitHub repo.
- The current dashboard is committed to a new branch with a unique name.
- A Pull Request is created from the new branch to the source branch.
- The Pull Request is merged with the source branch and closed.
- The GitOps system [ArgoCD/Terraform/CI-CD] automatically provisions your dashboard back to Grafana.
Win/Win
I'm even more of a fan of this approach after seeing it in action. You get all the benefits of GitOps while making dashboard editing accessible to the widest audience possible. The UX is fast and super lightweight - two clicks and an optional comment.
Proof of Concept
The video proof-of-concept is backed by real working code. I'm convinced a similar feature could be added to Grafana without any breaking changes.
Click for technical notes
Git configuration from Dashboard Links:
You might have noticed some Git-related links in the demo video's dashboard. These are used to configure the Git repository, branches, and file where the dashboard is stored. This worked great for a proof-of-concept, but it would be worth considering a new [optional] JSON schema element to store this data in the future. I'm not even sure a UI is needed for this configuration, since the Ops team could add this JSON with jq.
Production considerations for this feature:
- Security: Secrets (repository tokens) should be managed in code/config per Grafana standards. Recommendation for access token permissions/scopes should be included in the feature documentation. GitHub OAuth2 could be considered rather than Personal Access Tokens.
- Observability: this feature should generate appropriate logging, metrics, and traces.
- Configurability: each organization will have different Git workflows (approval/merge requirements, auto-merging, GitOps approaches). Open source projects may need branches to be created in a different repo entirely. This feature should support these various use cases.
Final Note
This challenge isn't specific to Grafana dashboards - you'll have to solve for the same issue with alerts and datasources. Likewise for most other observability vendors you manage with Infrastructure as Code.
The key difference is Grafana is open source and easy to customize!

